The Mean Lied to You: Meet the Median

Ten people are sitting in a café, each earning around $50,000 a year. The average income in the room is about $50,000. Then a billionaire walks in for a latte.
The average income in the café is now roughly $90 million. Nobody's life changed. The barista didn't get a raise. But the mean now describes nobody in the room.
Mean vs median in one sentence each
- The mean adds everything up and divides by the count. It's sensitive to extreme values.
- The median is the middle value when you sort everything. Half are above, half below. It barely notices the billionaire.
Skewed data is the normal kind
Many things we measure are right-skewed: most values are modest, a few are huge.
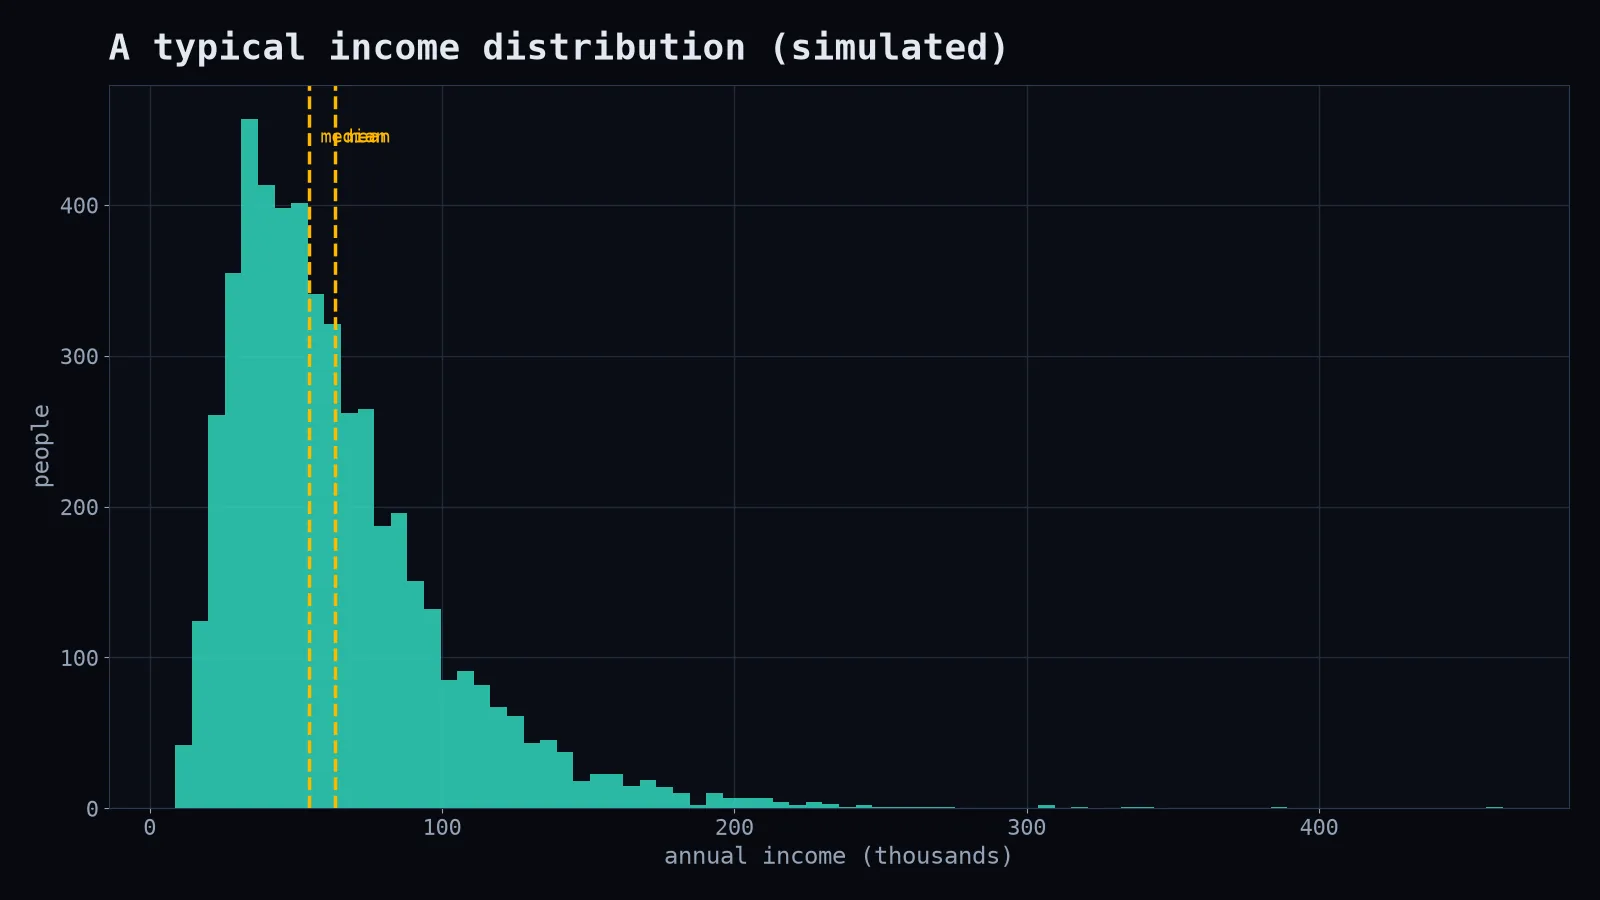
- incomes and house prices
- website session lengths
- time to resolve support tickets
- order values in e-commerce
- the number of followers people have
In all of these, the mean is pulled toward the tail. Reporting it alone can be misleading, sometimes innocently, sometimes not. "The average salary at our company is $140,000" can be true even if most employees earn much less than that, if the executives earn a lot.
A quick demonstration
import numpy as np

incomes = np.array([42, 48, 50, 51, 53, 55, 58, 61, 64, 70])  # thousands
print(incomes.mean(), np.median(incomes))   # 55.2  54.0

with_billionaire = np.append(incomes, 1_000_000)
print(with_billionaire.mean(), np.median(with_billionaire))
# ~90,960 vs 55.0
One extreme value moved the mean by a factor of over a thousand. The median moved by one.
When the mean is still right
The mean isn't evil. It's the right choice when:
- the data is roughly symmetric (heights, exam scores, measurement errors)
- you actually care about totals (total revenue = mean order value × number of orders)
- you're planning capacity: if your support team handles 1,000 tickets, the mean time per ticket tells you how many hours you need, tail included
Better habits for reporting
- Report both the mean and median when data might be skewed. If they're far apart, that's information.
- Show the distribution, not just one number. A histogram beats any summary statistic.
- Use percentiles for performance: "95% of pages load in under 1.2 seconds" is far more useful than "average load time is 0.6 seconds," because users feel the slow tail.
- Be suspicious of averages in headlines, especially about money.
The next time someone tells you the "average" anything, picture the billionaire in the café and ask: what's the median?