Correlation Is Not Causation (Ice Cream Didn't Cause That Shark Attack)
Every introductory statistics class tells this story, and it remains undefeated: in many coastal places, ice cream sales and shark attacks rise and fall together. Plot them and you get a lovely upward trend.
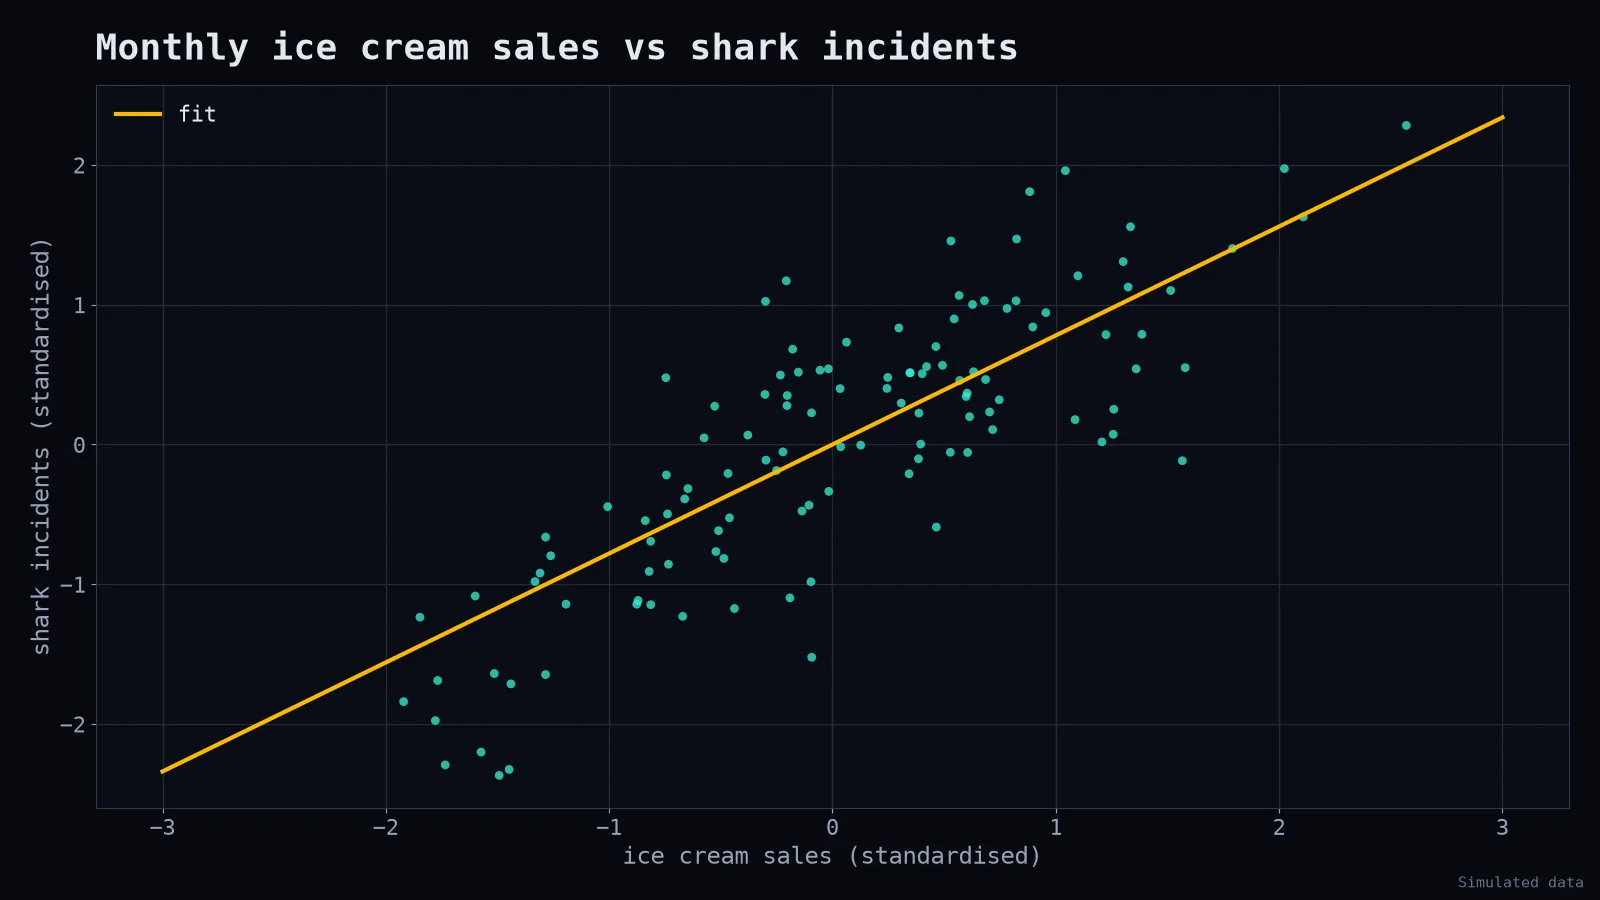
A reckless analyst concludes that ice cream causes shark attacks. A more creative one concludes that sharks are attracted to people who just ate ice cream. Both should be kept away from policy decisions.
The hidden third variable

Hot weather makes people buy ice cream. Hot weather also makes people swim in the sea, where sharks live. Ice cream and sharks are connected only through summer. In statistics, summer is a confounder: a variable that influences both things you're looking at.
Confounders are everywhere
- Cities with more police officers have more crime. (Bigger cities have both.)
- People who use a premium feature churn less. (Your most committed customers chose the premium feature.)
- Students who take extra tutoring score lower. (Struggling students are the ones sent to tutoring.)
- Hospitals with the best surgeons have higher death rates. (They get the hardest cases.)
That last one is why naive comparisons can punish the people doing the best work.
Other ways correlation fools you
Reverse causation. Does exercise make people healthy, or are healthy people more able to exercise? Often both.
Coincidence. With enough variables, some will correlate by pure chance. There are whole websites of hilarious spurious correlations between unrelated statistics.
Selection bias. If you only survey customers who stayed, you'll never hear why people left.
How to get closer to causation
- Randomised experiments. Randomly assign who gets the new feature (an A/B test). Randomisation balances confounders you didn't even think of. This is the gold standard when it's possible and ethical.
- Control for known confounders. Compare within groups (same city size, same season) or include them in a regression model.
- Natural experiments. Sometimes a policy, a border or a random event creates comparable groups for you.
- Draw the causal diagram. Literally sketch arrows between variables before analysing. It forces you to say what you believe causes what.
import statsmodels.formula.api as smf

# naive
smf.ols("sharks ~ ice_cream", data=df).fit().params

# controlling for temperature: the ice cream effect shrinks toward zero
smf.ols("sharks ~ ice_cream + temperature", data=df).fit().params
How to say it in a meeting
Instead of "X causes Y," try: "X and Y move together. We haven't ruled out that something else, like seasonality, drives both. If we want to know whether changing X changes Y, we should test it."
It sounds less exciting. It's also much less likely to end with your company banning ice cream.