Simpson's Paradox: When the Data Plays Tricks on You

Here's a puzzle. Two treatments for kidney stones. Overall, Treatment B has a higher success rate than Treatment A.

But split the patients into mild and severe cases, and Treatment A wins in both groups.
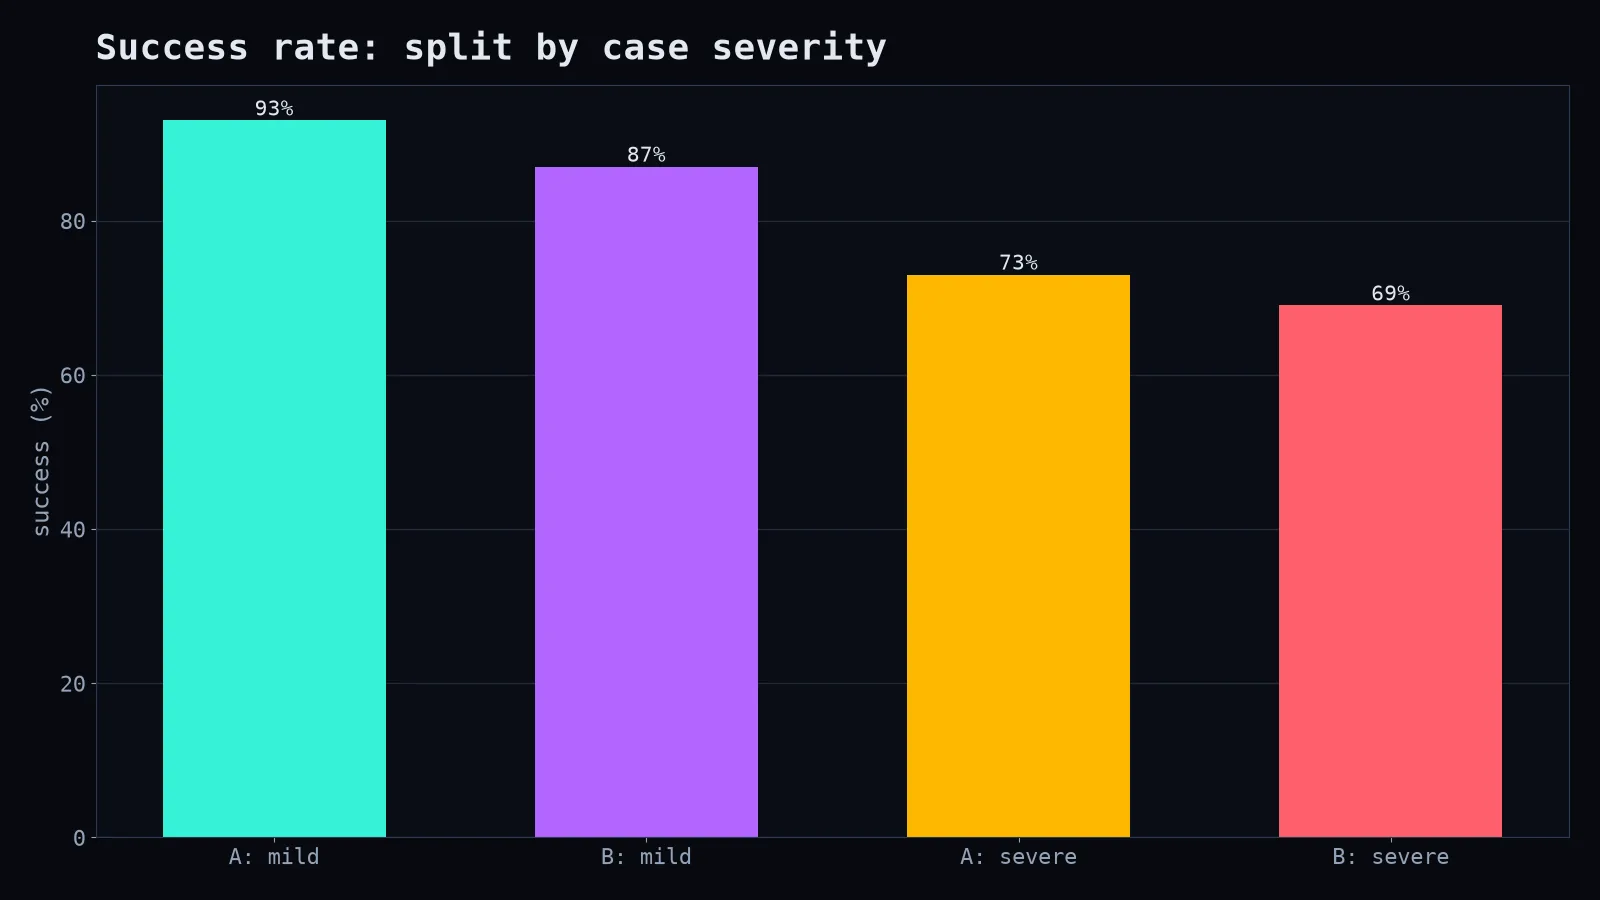
How can A be better in every group and worse overall? This is Simpson's paradox, and these numbers are close to a real, much-cited medical study.
What's going on
The two treatments weren't given to the same mix of patients. Doctors tended to use Treatment A (the more invasive one) for severe cases and Treatment B for mild ones. Severe cases have lower success rates no matter what you do.
So Treatment A's overall average is dragged down by handling most of the hard cases. Treatment B's overall average is flattered by getting mostly easy ones. The overall comparison is really comparing case mixes, not treatments.
A business version
Your two sales teams:
| Team North | Team South | |
|---|---|---|
| Small clients | 40% close rate | 30% close rate |
| Big clients | 15% close rate | 10% close rate |
| Overall | 18% | 27% |
Team North is better with small clients and better with big clients, but worse overall, because North was given mostly big, hard-to-close accounts. Promote South based on the overall number and you'll reward the easier territory, not the better team.
When to suspect it
- Groups being compared have very different compositions (ages, sizes, regions, difficulty).
- Something decides which group gets which treatment, and that something also affects the outcome.
- You're comparing hospitals, schools, sales teams, ad campaigns or time periods where the mix changed.
How to protect yourself
import pandas as pd

# overall
df.groupby("treatment")["success"].mean()

# within each segment
df.groupby(["severity", "treatment"])["success"].mean().unstack()- Always look at the breakdown by the most likely confounding variable.
- Check group sizes, not just rates. The paradox lives in unequal mixes.
- Ask how assignment happened. Was it random? If not, who decided, and based on what?
- When possible, randomise. Randomised assignment balances the mix and makes the paradox disappear.
But which answer is "right"?
It depends on the causal story. For the kidney stones, severity affects both treatment choice and outcome, so the within-group comparison is the fair one: A is better. But in other situations, the variable you split on is itself caused by the treatment, and splitting on it would mislead you. That's why statistics alone can't settle it. You need to understand how the data came to be.
Aggregates are summaries, and summaries throw information away. Simpson's paradox is just the most dramatic reminder that sometimes they throw away the important part.