Reading a Histogram Like a Pro
You take a photo on a sunny day. On the camera screen it looks perfect. At home on your computer it's dark and muddy. What happened? Your camera screen was competing with the sun, and it lost.
The histogram never loses. It's the most honest thing on your camera.
What it shows
A histogram is a chart of brightness. The horizontal axis goes from pure black on the left, through midtones, to pure white on the right. The height at each point shows how many pixels have that brightness.
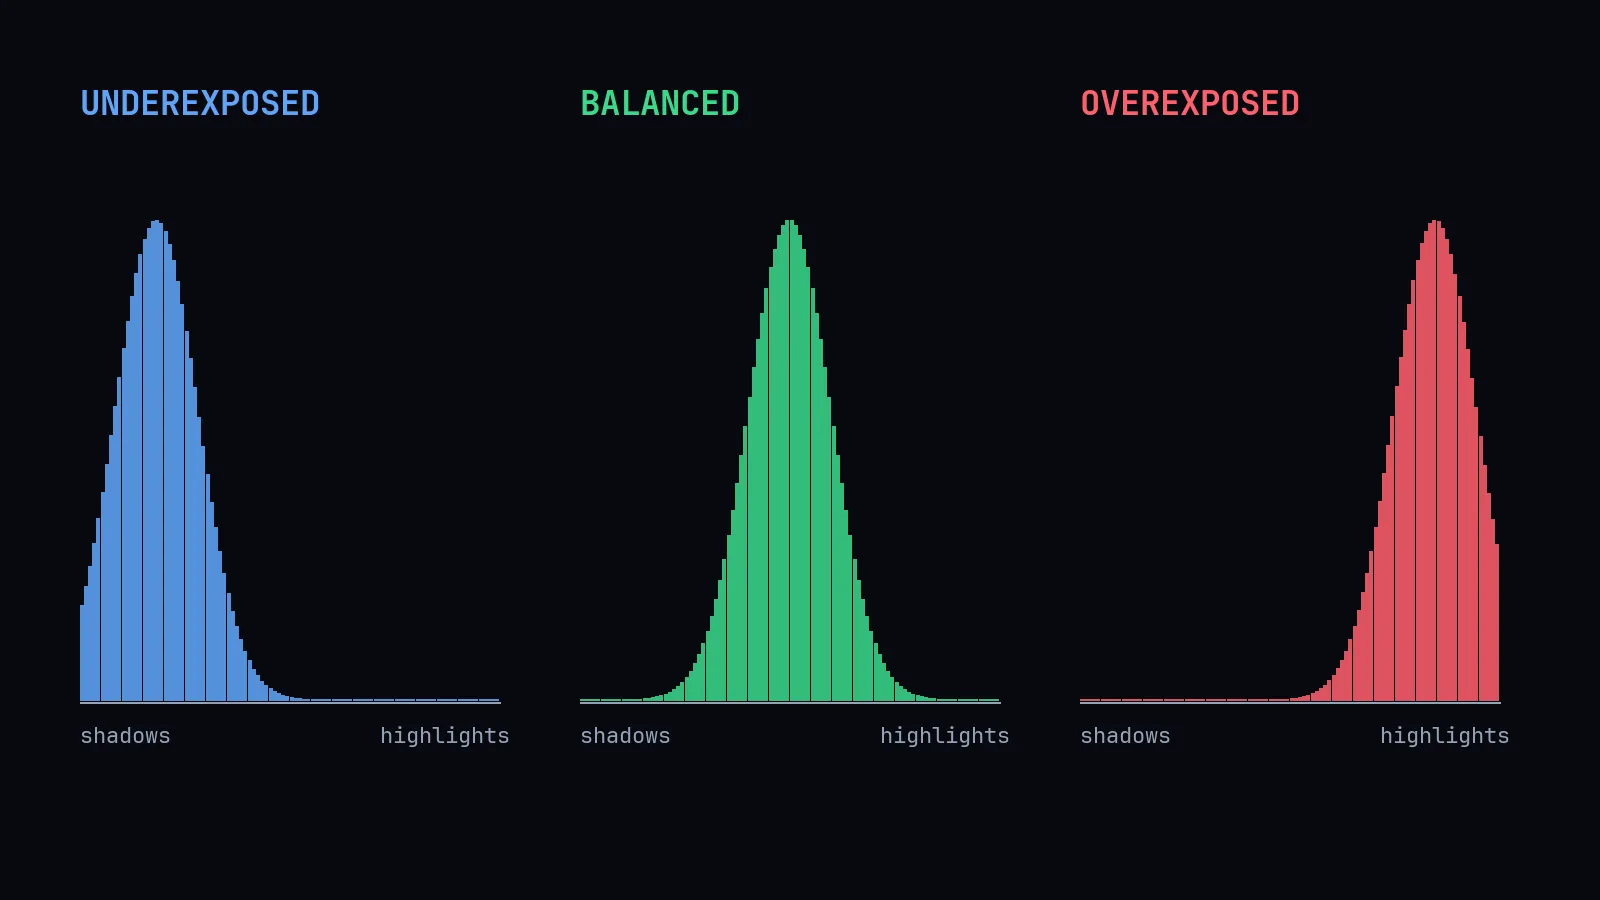
- Bunched up on the left: lots of dark pixels. Possibly underexposed.
- Bunched up on the right: lots of bright pixels. Possibly overexposed.
- Spread across: a full range of tones.
There's no "perfect" shape
A photo of a black cat on a black sofa should have a histogram crowded to the left. A snowy landscape should lean right. The histogram describes the photo; it doesn't grade it. Your job is to check whether it matches what the scene really looks like.
Clipping: the thing to actually worry about
When the graph slams into the left or right edge, you have clipping. Those pixels are pure black or pure white, with no detail left to recover.
- Clipped highlights (right edge) are usually the bigger problem: a blown-out sky or a white wedding dress with no texture. Once it's pure white, editing can't bring back the detail.
- Clipped shadows (left edge) are often acceptable, even artistic, as long as nothing important is hiding there.
Many cameras can show "blinkies," flashing areas on the preview where highlights are clipped. Turn that on.
Exposing to the right
A popular technique, especially for RAW files, is to expose as brightly as possible without clipping highlights, then darken in editing. Digital sensors capture more tonal information in the brighter part of the range, so brighter capture often means less noise in the shadows after editing.
Use it with care: it's great for landscapes on a tripod, less useful when you're chasing a toddler at a birthday party.
RGB histograms
Some cameras show separate red, green and blue histograms. A single channel can clip even when the combined histogram looks fine; a vivid red flower can lose all its texture in the red channel. If you photograph saturated colours (sunsets, flowers, stage lights), check the channels.
On your phone
Most phone camera apps don't show a histogram by default, but many "pro" or "manual" modes do, and editing apps like Lightroom or Snapseed show one while you edit. When adjusting exposure in an edit, watch the histogram instead of trusting a screen that might be dim, bright or tinted.
The habit
After important shots, glance at the histogram. Two seconds. It catches problems your eyes can't, especially outdoors. Your screen tells you how the photo feels. The histogram tells you what you actually captured. Trust the histogram.