Vision Transformers for Satellite Images, Without the Jargon
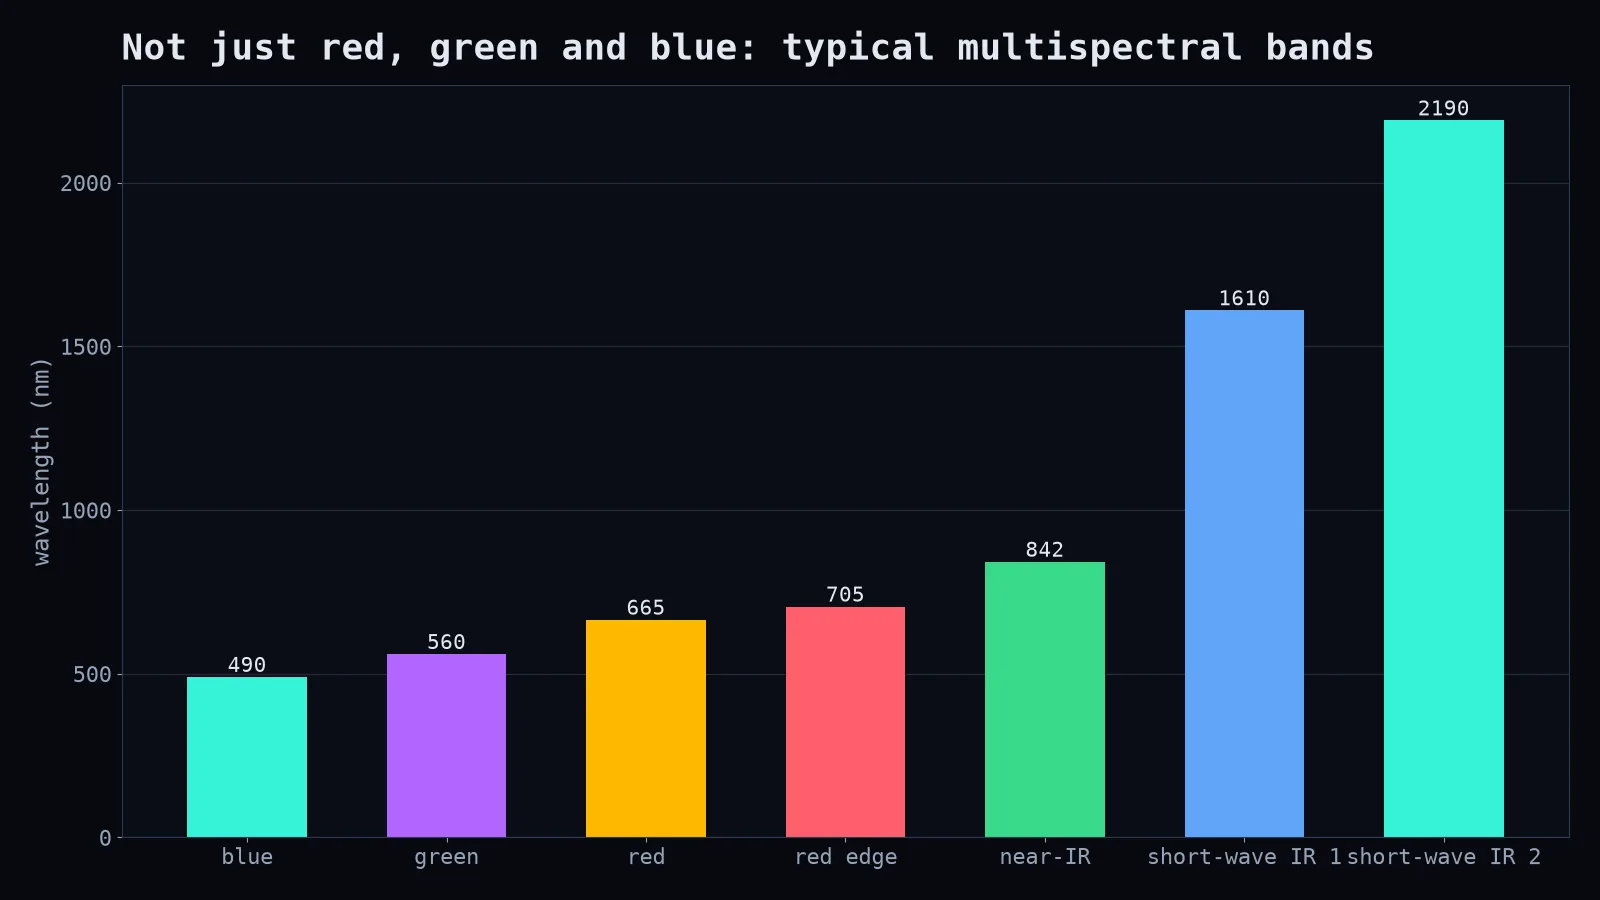
Your phone camera sees three colours: red, green and blue. Many Earth-observation satellites see several more, including light your eyes can't see at all. Plants, for example, reflect a lot of near-infrared light, so in the right band a healthy field glows like a neon sign.
That's one reason satellite images are such a good playground for machine learning, and one reason they're trickier than holiday photos.
What we want from these images
Questions like:
- Where is the water, and how has the shoreline changed?
- Which areas are covered by aquatic vegetation this season?
- Where did a flood spread after the storm?
- How much forest disappeared since last year?
Each of these can be framed as segmentation: label every pixel (or small area) as water, vegetation, built-up land and so on.
Enter the vision transformer
Transformers were originally built for text: they read a sentence as a sequence of tokens and let every token "pay attention" to every other token. A vision transformer does the same with images. It cuts the image into small square patches, turns each patch into a token, and lets the patches compare notes.
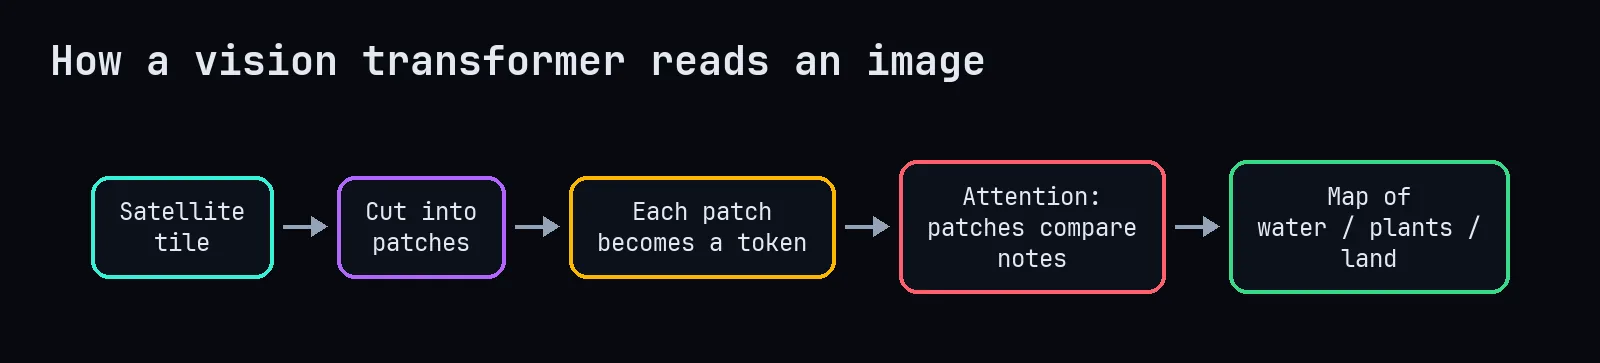
Why is that helpful for satellite data? Because context matters. A dark patch could be water, shadow or fresh asphalt. Looking at the surrounding patches (a river shape, a city grid, a mountain) helps decide.
Why satellite data is weird
- More than three channels. Models pre-trained on normal photos expect RGB. Using the extra bands well often needs adapting the first layers or training on satellite data directly.
- Clouds. The single most annoying object in Earth observation. You need cloud masks, or images from several dates, or radar, which sees through clouds.
- Huge images. One scene can be thousands of pixels wide, so you work in tiles and stitch results back together.
- Few labels. Labelling pixels requires experts and field data. Unlabelled imagery is abundant; labels are precious.
- Seasons and sensors change. A model trained on summer images can struggle in spring. Different satellites have different bands and resolutions.
Mixing physics with deep learning
One approach I find promising is combining physical knowledge with learned models. Scientists have long used spectral indices such as NDVI, which compares near-infrared and red light to measure vegetation:
import numpy as np

def ndvi(nir: np.ndarray, red: np.ndarray) -> np.ndarray:
    return (nir - red) / (nir + red + 1e-6)
Feeding the model physically meaningful inputs like these, alongside raw bands, can help it learn faster from fewer labels and behave more sensibly on new regions. Physics provides the common sense; the transformer provides the pattern recognition.
Why it matters
Satellites revisit the same places every few days, for free or nearly free in some programmes. With good models, that becomes a continuous health check for lakes, coastlines, crops and forests. For countries facing floods and climate change, including my home country, that's not a research curiosity. It's an early-warning system.