Data Cleaning: The 80% of the Job Nobody Puts on LinkedIn
LinkedIn data science posts show neural networks, beautiful dashboards and words like "insights." Nobody posts a screenshot of themselves discovering that the country column contains "Bangladesh," "bangladesh," "BD," "Bangaldesh" and, inexplicably, a phone number.
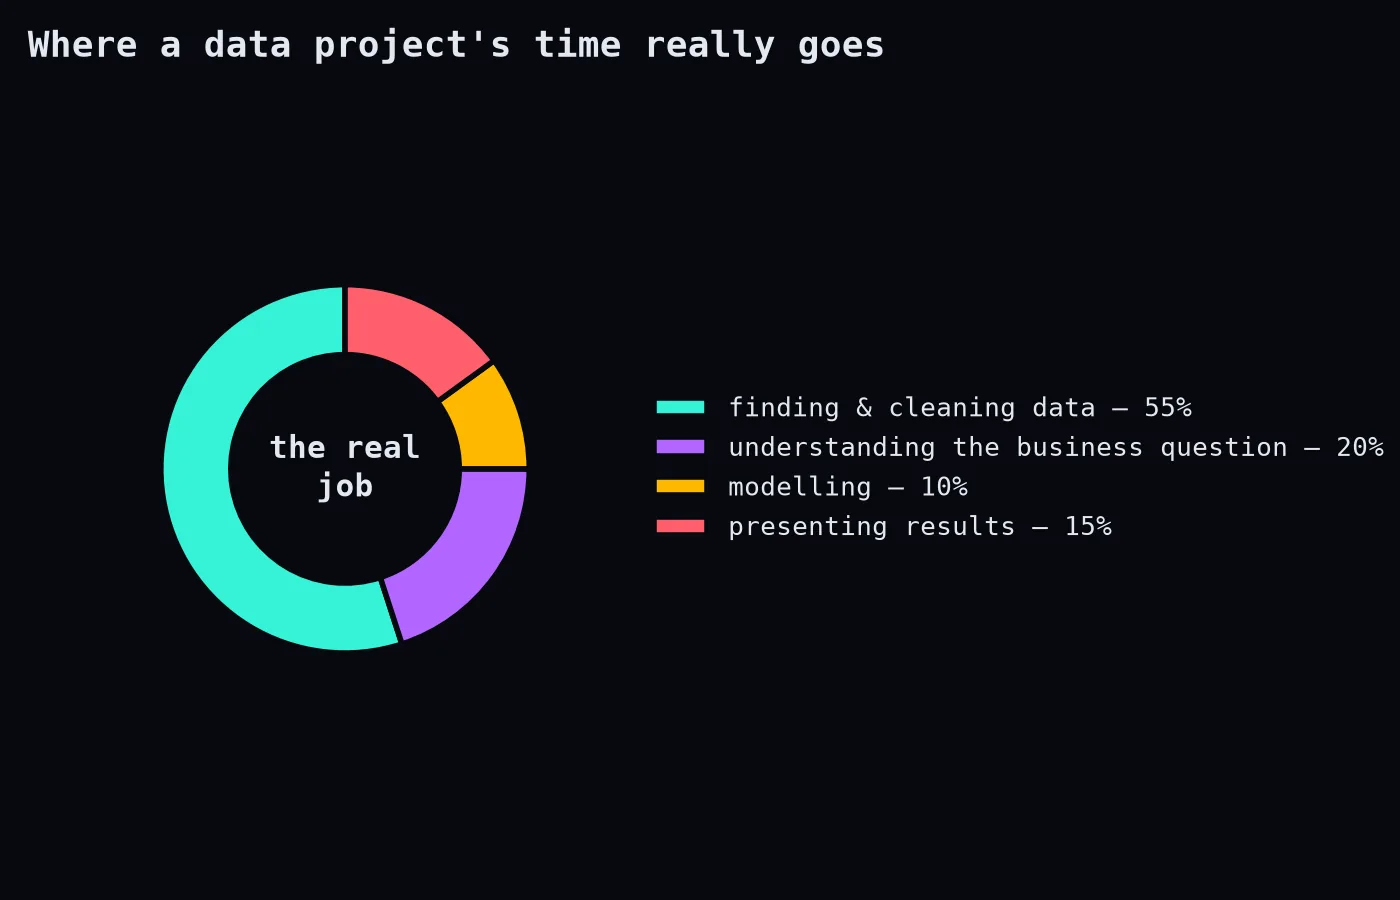
Yet that's where most of the job happens.
Start by looking, not cleaning
Before changing anything, understand what you have:
import pandas as pd

df = pd.read_csv("customers.csv")
df.info()                                  # types and missing values
df.describe(include="all").T               # ranges, unique counts
df.isna().mean().sort_values(ascending=False).head(10)   # worst columns
df.duplicated().sum()
Ten minutes of looking prevents a week of wrong conclusions.
The usual suspects
Inconsistent text.
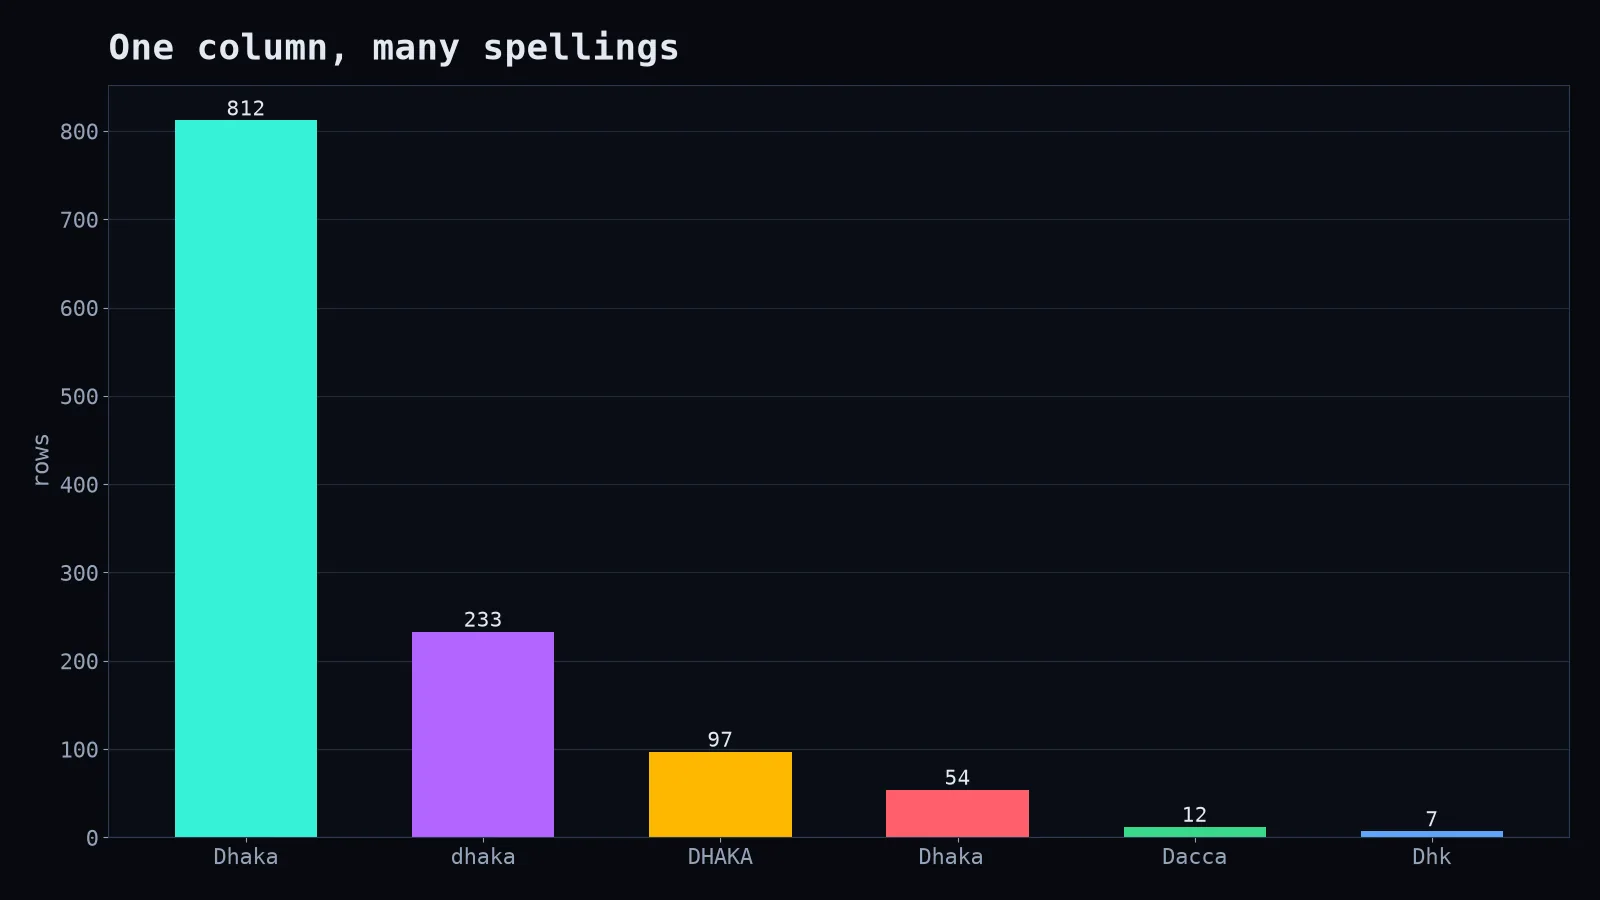
df["city"] = (df["city"].str.strip().str.title()
              .replace({"Dacca": "Dhaka", "Dhk": "Dhaka"}))
Duplicates. Exact duplicates are easy. Near-duplicates (same person, different email capitalisation) need a rule: normalise first, then deduplicate on the normalised key.
Missing values. The question isn't "how do I fill them?" but "why are they missing?" A blank income field might mean "unemployed," "refused to answer" or "the form had a bug in March." Each needs different handling. Sometimes the missingness itself is the most useful feature.
Dates in multiple formats. 03/04/2025 is 3 April in Bangladesh and the UK and 4 March in the US. Find out the source, then parse explicitly:
df["signup"] = pd.to_datetime(df["signup"], format="%d/%m/%Y", errors="coerce")
print(df["signup"].isna().sum(), "dates failed to parse")
errors="coerce" turns bad values into missing values instead of crashing, and printing the count makes sure you notice.
Impossible values. Ages of 212, negative prices, orders delivered before they were placed. Decide whether they're typos, test data or real edge cases, and document the decision.
Units. One system stores weight in kilograms, another in grams. One country reports revenue in thousands. Nothing will error. Your chart will just be wrong by a factor of 1,000.
Rules I live by
- Never edit the raw data. Keep the original, write cleaning as code, and produce a new clean dataset. You'll need to re-run it.
- Log what you changed and why. "Removed 312 rows with test emails" belongs in a README.
- Check counts after every step. If a merge turned 10,000 customers into 14,000, stop.
- Ask the people who created the data. Five minutes with the operations team beats five hours of guessing.
Why it matters
Every model, dashboard and decision downstream inherits your data's problems. A brilliant model on dirty data is just a confident way of being wrong. Cleaning data isn't the boring part before the real work. It is the real work. It's just not very photogenic.